A/B Line Graph
To reach high alcohol levels, sake brewing uses a process called Multiple Parallel Fermentation. Essentially, sugars are produced at the same time you are making alcohol. This means there is no such thing as Original and Final Gravity in Sake Brewing. So how do you know you have a healthy fermentation? The A/B Line.
By plotting the changes in gravity over time against the % of alcohol by volume in the fermentation we can identify ideal trends base on successful batches. In the image below, you can see a line drawn from 8° Baumé at 0% alcohol, which decends toward 0° Baumé at 18% alcohol by volume.
Before you get started, just note that this process requires your ability to take brix and density measurements (specific gravity) on your brew. I explain how, but in some cases you’ll need to invest some money to make those measurements more frequent or accurate.
“By plotting the changes in gravity over time against the % of alcohol by volume in the fermentation we can identify ideal trends based on successful batches. ”

The A/B Line (Alcohol vs Baumé) showing an ideal progression of sugar production to alcohol production.
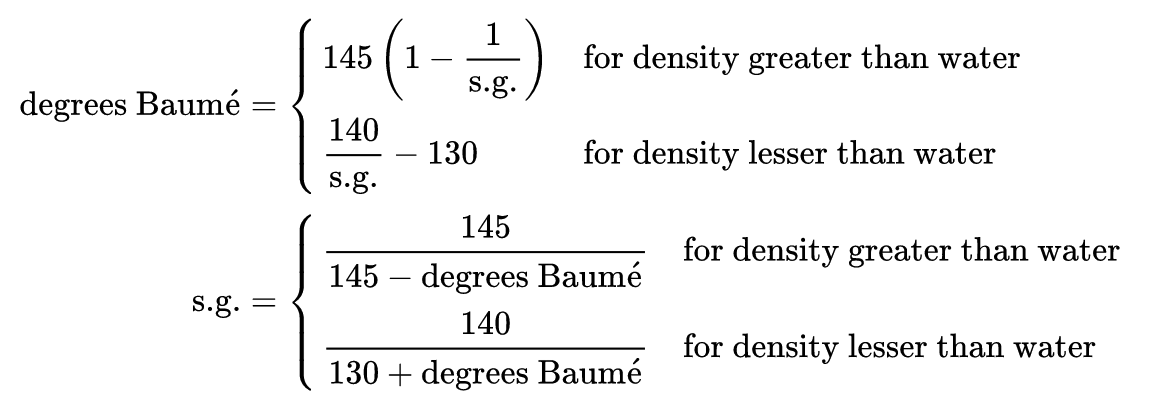
Baumé vs Specific Gravity
The Baumé scale, developed by Antoine Baumé, is split into two different scales: one for liquids heavier than water and the other lighter than water.
The A/B Line, as you can see in the image above, is a comparison of Alcohol and Baumé. For simplicity of the numbers the Heavy Baumé scale is used because most values of density fall in between 0 and 10. However, if Baumé is not your preferred scale, you can just as easily substitute Specific Gravity or others because the principle of the results are relative.
“If Baumé is not your preferred scale, you can just as easily substitute Specific Gravity or others because the principle of the results are relative.”
Plot sample showing degree of alcohol for a given density (in baumé). A control is plotted against two other fermentations for comparison.
It is important not to think of the scale as a time-based measurement, although you’ll be temped to. The density is mostly controlled by the amount of dissolved sugars in the mash. In the early days of the ferment, the koji (malt) will break down, leeching enzymes into solution, which will break down the starches in the rice into smaller chain sugars.
Unlike beer, which you need to pitch a very large amount of yeast to equal an equivalent °Plato (yet another form of measuring sugar content through density), sake requires much less yeast, because the number of cells is built up over the course of multiple days through natural population growth.
During this time, the yeast is not consuming as much sugar and the density of the mash grows very quickly due to the koji enzymes, which don’t have any sort of lag time or growth phase. They simply just start making sugars.
Around day 3 or 4 of the mash, the gravity will reach a sort of “apex” as the yeast begins anaerobic fermentation, of which the main by product is Alcohol. I’m being careful to not indicate this has any relationship to “original gravity” because if you were to suddenly increase the temp to 60°C for a day, you’d denature the yeast, but the koji enzymes would continue to produce immense amounts of sugar, probably doubling or tripling this level in just a matter of hours. Likewise, if you were to drop the temp to 0°C, the yeast might go dormant, but the koji enzymes would still continue to operate on the starch, producing similar results, albeit at a much slower rate.

Plot showing an “ideal average” fermentation against two on-going batches.
In the above graph, you can see an “average” slope from 8,0 to 0,18. If fermentation was really that simple, it wouldn’t be any fun. In reality, the lines look more like the yellow and red. The straight blue line is just to show how the previous “good” fermentations progressed so that we can correct our current fermentations.
Making Corrections
There are a few basic changes that can be made in order to drive a fermentation in the direction you want it to go. In almost any normal fermentation (ie: temps, ingredients, etc), koji enzymes will continue to create sugars and yeast will continue to convert it to alcohol. These two actions have both wanted and unwanted effects. The biology of yeast cells is relevant now. Too much sugar or alcohol will cause the yeast cells to die or perhaps inhibit proper growth, leading to small or malformed cells.
Each yeast strain is different and you need to find what works best, but these truths will apply to any of them. We want to find what produces the best aroma, best taste, least contamination, and most reliable fermentation (in otherwords, we don’t want to worry about stalling).
When the ABV is LESS than 10%:
If the Baume is lower than expected, we need to cool down the mash to slow alcohol production.
If the Baume is higher than expected, we can add a little water (less than 2% total water per day). This will lower osmotic stress on the yeast and allow it to perform better.
When the ABV is MORE than 10%:
If the Baume is lower than expected, we can still cool down the mash to slow alcohol production, but we need to be careful not to stall the ferment. Don’t make large adjustments. Drop the temp maximum 0.8°C per day and make further adjustments after daily testing.
If the Baume is higher than expected.
Let’s Talk about Stress
Yeast, especially sake yeast, performs its best under ideal conditions. But, while that is a topic for another article some things here are very relevant:
Stressed yeast actually produces more esters and aromatic components.
Yeast can be “trained” to withstand higher stresses.
Stressed yeast that don’t have the proper tolerance will produce unwanted aromas and amino acids.
We can’t say for sure how to deal with every strain of yeast, but making a yeast starter is going to help substantially with the health of the ferment. Even 1-3 days of conditioning is going to make a world of difference in the long weeks ahead. Having stronger yeast will help them replicate faster and produce healthier offspring in conditions that are normally going to slow them down or halt ethanol production altogether. [1]
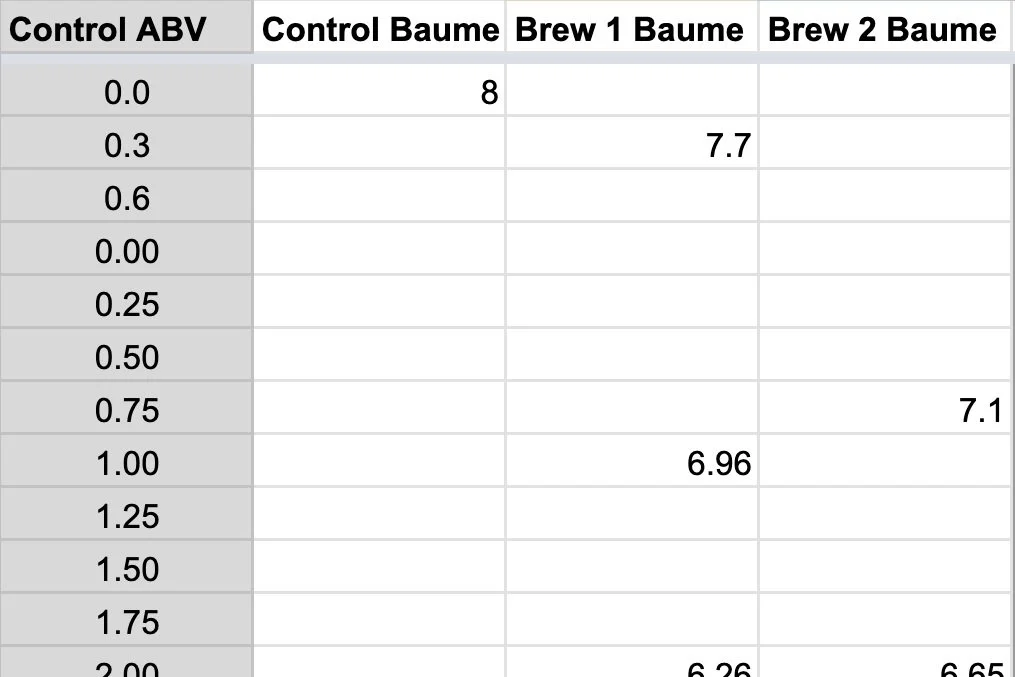
Plotting Your Own Values
Get started by copying the A/B Line Graph spreadsheet that we’ve prepared for you.

Select “Make a Copy” from the File menu and then close the original so you can edit.
At a home brew scale, you’ll need at least a way to measure gravity and brix. Once you have these you can estimate the ABV using another calculation [2][3].
Basically it’s:
ABV = 1.646 * BRIX - 2.703 * (145 - 145 / SG) - 1.794
William Auld, please buy his book, did some incredible work to determine home brew methods for measuring alcohol with limited resources. There is a degree of error that we must accept during this process however and you are likely to say the ABV is between 14-18% rather than 16.4%. In addition to that, you need to use quite a bit of your batch to filter out into clear sake, before you can take a gravity measurement with a hydrometer and then a brix measurement. In most cases, assume you’ll have fewer data points for the A/B Graph than you would in a commercial setting.
If you are willing to spend a little more money ($400-1000 USD) there are some more accurate options that are still far less than the commercial production equipment which can run 20,000USD or more.
Pycnometers and a really accurate scale is one way.
The Anton Paar: Easy Dens and the Atago: Sake brix/acidity meter are simpler.
If you are a commercial brewer, you probably have an Ebulliometer to measure the ABV and are making large enough fermentations that a 250ml filtered sample for the hydrometer isn’t outrageous.

Regardless of how many data points you have, just plot the readings in one of the columns “control”, “brew 1”, or “brew 2”. These are basically 3 separate brews that you can use to compare. You plot the gravity reading (converted to Baumé) at the corresponding ABV for that day.
It’s difficult to say how the line “should” look, because it all depends on how you want your fermentation to progress, but suffice it to say, if you take readings on 3 fermentations, and one tastes sweeter than the others, it probably has a slope that ends above the others. Likewise, if the sake is drier than the others it might end below.
This is where the changes mentioned above become relevant. By adding water, cooling the tank, allowing the temperature to rise, or even holding back water at the beginning, we can change the direction of the line and the ultimate flavor and aroma of the sake.
Conclusion
A/B Lines are all about relative measurements to other fermentations. You plot the first one and then compare the second and third to compare how they differed from each other. Which ever you liked the most in flavor and aroma, you should try to repeat by following that recipe again and try to make the changes discussed above to course correct if the new fermentation starts to veer off course.
We’ll talk more about the effects of these changes on the final sake in another post, and if we missed something or it wasn’t clear, let us know and we’ll update the article.
References:
Auesukaree C. Molecular mechanisms of the yeast adaptive response and tolerance to stresses encountered during ethanol fermentation. J Biosci Bioeng. 2017 Aug;124(2):133-142. doi: 10.1016/j.jbiosc.2017.03.009. Epub 2017 Apr 17. PMID: 28427825.
Auld, William. (2010-12) Measuring your Sake – Part One: the Hydrometer and SMV. Home Brew Sake. https://homebrewsake.com/measuring-your-sake-%E2%80%93-part-one-the-hydrometer-and-smv/
Auld, William. (2011-01) Measuring your Sake – Part Two: Percent Alcohol by Volume. Home Brew Sake. https://homebrewsake.com/measuring-your-sake-%E2%80%93-part-two-percent-alcohol-by-volume/